Data Visualization in Machine Learning

👋 Hey, I'm a tech writer, making tech easy for newbies. 📚✨
I'm on a mission to decode tech concepts, from AI to web development, using relatable examples 🌐🔍
Join me on this journey to demystify tech—let's learn together, one article at a time! 🚀📝🔗
Humans tend to understand things better through graphical illustrations. Data visualization is a crucial aspect of machine learning that makes it easier for us to understand patterns, trends, and outliers and also draw insights from them. For an individual who is new to the data world, staring at datasets might not make any sense, but once graphical representations are shown, the person quickly understands what the dataset is about to an extent.
In this article, I will discuss the importance of data visualization in machine learning, how it is used in the field, and its various types.
Data Visualization
Data visualization is the representation of data or information in a graph, chart, or other visual format. It communicates relationships of data with images. Data visualization is another form of visual art that grabs our interest and keeps our eyes on the message.
Why Data Visualization
A visual summary of information makes it easier to identify patterns, trends and outliers than looking through rows of data on a spreadsheet. Since the purpose of data is to gain insights, data is much more valuable when it is visualized.
Our eyes are drawn to colours and patterns. We can quickly identify red from blue, and square from a circle. Our culture is visual, including everything from art and advertisements to TV and movies.
How is Data Visualization Useful?
Do you know you've been surrounded by data all this time? Well, below are some of the areas where data visualization is being used to make us understand data better.
- Google Map Traffic visualization
The live traffic status in Google Maps is a simple example of what is possible through data visualization to make human lives simple and easy. You can see the red colour indicating slow traffic area in the city on the map and the blue colour indicating free road etc.

2. Hard Disk Drives Data Visualization
The blue line and empty space in the horizontal bar and in the pie chart is an example to inform about the consumed and free space in the hard disk.
Hard drive data status in interactive visualization is effective to understand even for a normal user.
That’s always the target of data visualization to make it so much easy and relevant for people to understand and make quick decisions.

3. Geo-Spatial Data Visualization
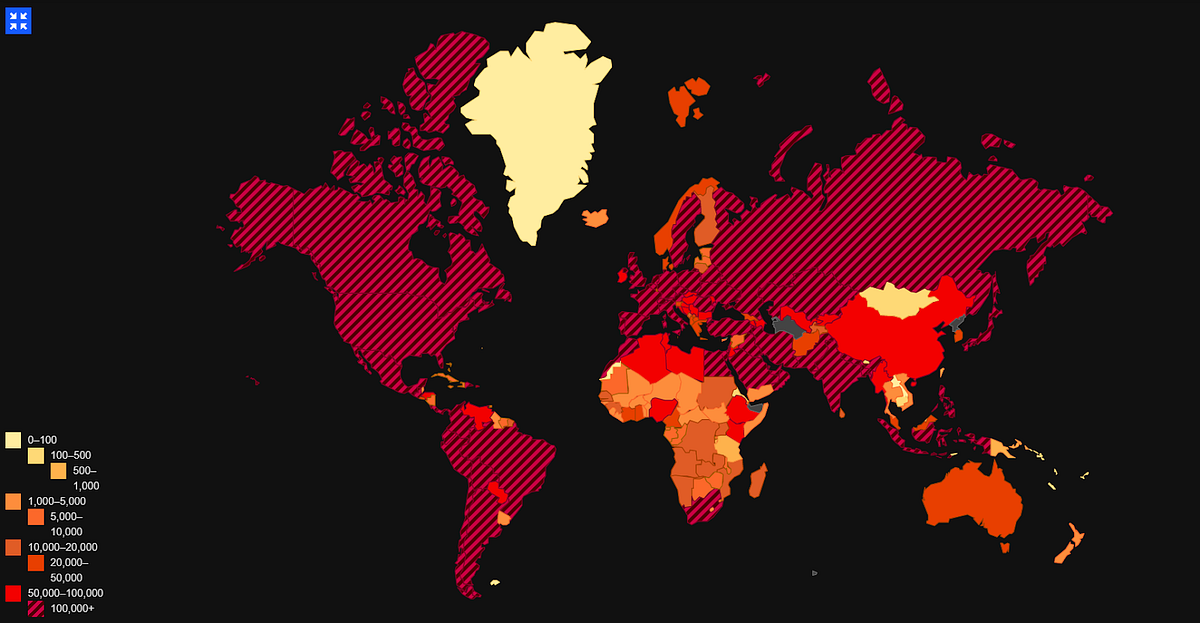
Geospatial visualizations are one of the earliest forms of information visualization. Amongst the various types of geospatial visualizations, Heat maps are useful when you have to represent large sets of continuous data on a map using a colour spectrum.
The map of the world in the next slide shows the world population affected by COVID-19 using different shades of red. The darker the shade of red, the higher the affected population.
Data Visualization in Python
Python offers multiple great graphing libraries that come packed with lots of different features. No matter if you want to create interactive, live or highly customized plots, python has an excellent library for you.
To get a little overview here are a few popular plotting libraries:
Matplotlib: Matplotlib is the most popular Python plotting library. It is a low-level library with a Matlab-like interface which offers lots of freedom at the cost of having to write more code.
Seaborn: Seaborn is a graphic library built on top of Matplotlib. It allows you to make your charts prettier and facilitates some of the common data visualization needs.
Pandas Visualization
ggplot
Plotly
Bokeh
Types of Data Visualization Approaches
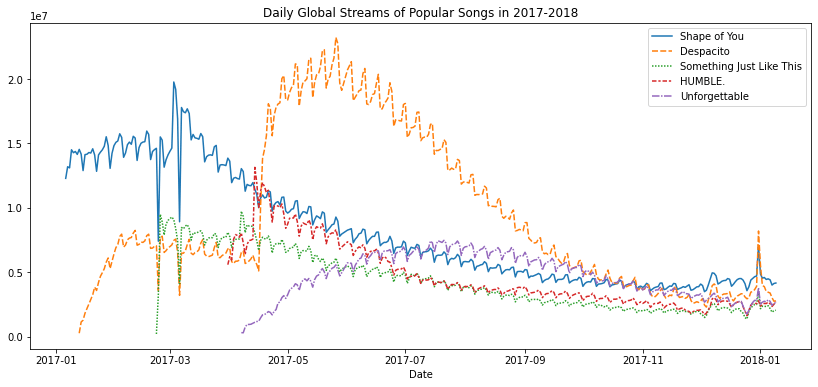
- Line Charts: In a line chart, each data point is represented by a point on the graph, and these points are connected by a line. We may find patterns and trends in the data across time by using line charts. Time-series data is frequently displayed using line charts.
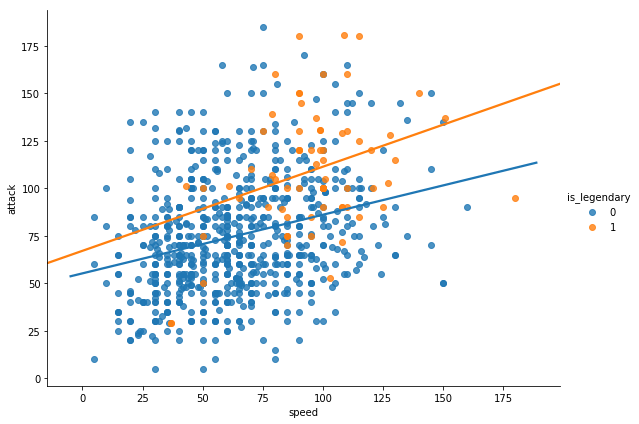
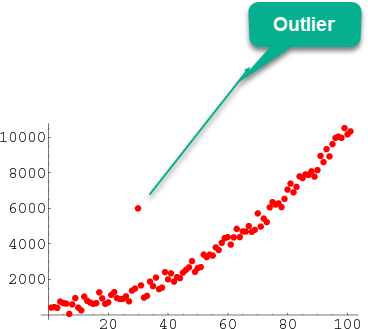
2. Scatter Plots: A quick and efficient method of displaying the relationship between two variables is to use scatter plots. With one variable plotted on the x-axis and the other variable drawn on the y-axis, each data point in a scatter plot is represented by a point on the graph. We may use scatter plots to visualize data to find patterns, clusters, and outliers.
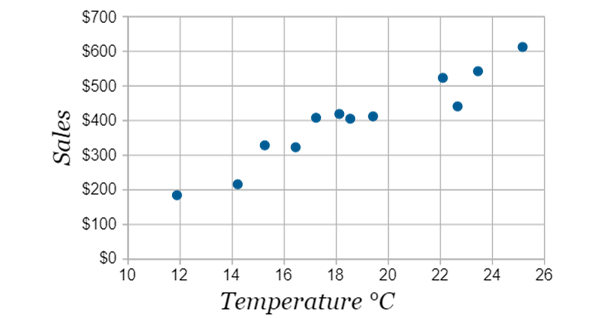
As you now know, scatter plots are used for interpreting trends in data. Let’s check an example of a scatter plot between temperature and ice cream sales in dollars. What is the trend in this scatter plot? Roughly we can say that as temperature increases, ice cream sales increase. Who wouldn’t want an ice cream on a hot day?
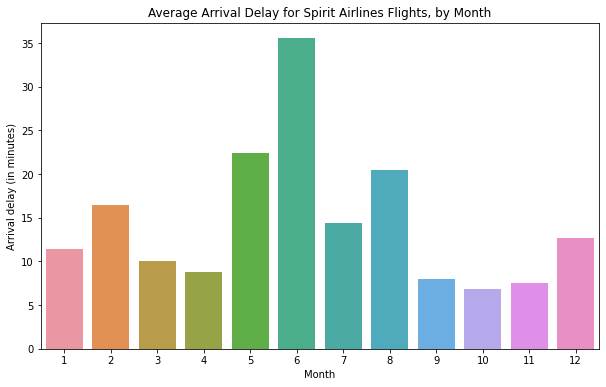
3. Bar Charts: Bar charts are a common way of displaying categorical data. In a bar chart, each category is represented by a bar, with the height of the bar indicating the frequency or proportion of that category in the data. Bar graphs are useful for comparing several categories and seeing patterns over time.
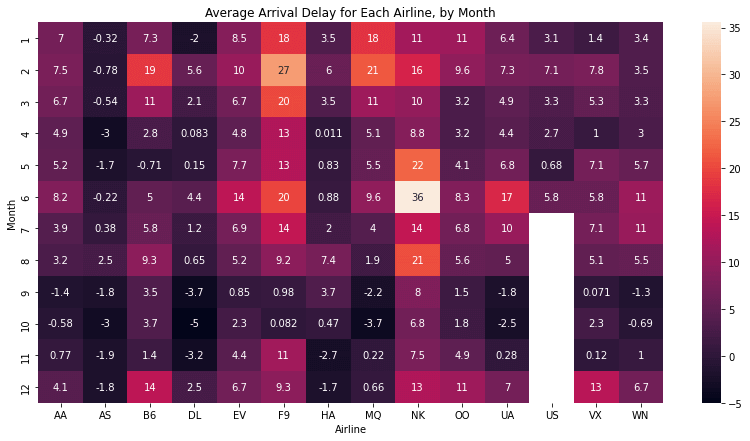
4. Heat Maps: Heat maps are a type of graphical representation that displays data in a matrix format. The value of the data point that each matrix cell represents determines its hue. Heatmaps are often used to visualize the correlation between variables.
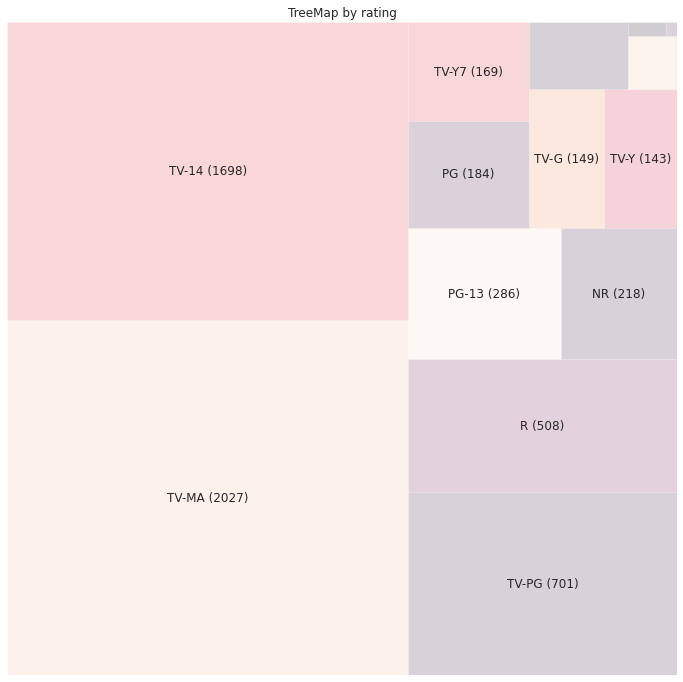
5. Tree Maps: Tree maps are used to display hierarchical data in a compact format and are useful in showing the relationship between different levels of a hierarchy.
6. Box Plots: Box plots are a graphical representation of the distribution of a set of data. In a box plot, the median is shown by a line inside the box, while the centre box depicts the range of the data. The whiskers extend from the box to the highest and lowest values in the data, excluding outliers. Box plots can help us to identify the spread and skewness of the data.
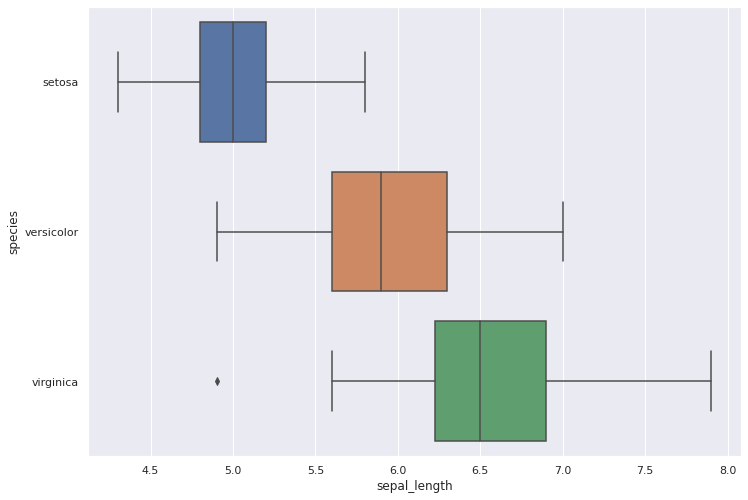
Outlier
In statistics, an outlier is a data point that differs significantly from other observations.
Importance of Data Visualization in Machine Learning
Data visualization helps to tell stories by curating data into a form easier to understand, highlighting the trends, patterns, and outliers. A good visualization tells a story, removing the noise from data and highlighting useful information.
Data visualization helps machine learning analysts to better understand and analyze complex data sets by presenting them in an easily understandable format. Data visualization is an essential step in data preparation and analysis as it helps to identify outliers, trends, and patterns in the data that may be missed by other forms of analysis.
With the increasing availability of big data, it has become more important than ever to use data visualization techniques to explore and understand the data. Machine learning algorithms work best when they have high-quality and clean data, and data visualization can help to identify and remove any inconsistencies or anomalies in the data.
Challenges in Data Visualization
While data visualization is a powerful tool for machine learning, several challenges must be addressed.
Choosing the Right Visualization Technique: There are numerous visualization techniques available, and selecting the right one requires an understanding of the data and the message that needs to be conveyed so it can be easily understood by others.
Data Quality: Data visualization requires high-quality data. Inaccurate, incomplete, or inconsistent data can lead to misleading or incorrect visualizations. When displaying the data, it is crucial to make sure it is accurate, consistent, and comprehensive.
Over-emphasis on Aesthetics: While aesthetics are important, overemphasizing the visual appeal of the visualization at the expense of accuracy and clarity can be problematic. Data visualizations should prioritize the accuracy and effectiveness of the message over aesthetics.
Audience Understanding: Another challenge in data visualization is ensuring that the target audience can interpret and understand the visualizations. Visualizations should be designed with the audience in mind and should be clear and concise.
Technical Expertise: Creating effective data visualizations often requires technical expertise in programming and statistical analysis. Data analysts and data scientists need to be familiar with programming languages, visualization tools, and statistical concepts to create effective visualizations.
In conclusion, data visualization is a very important aspect in the data world. Humans understand things better with the help of graphics illustrations.
You read till the end, awesome!
Remember, you know more by doing. The only way to understand machine learning is to build models as much as you can.
If you find this article helpful, kindly give some reactions. Also, if you have any comment, the comment section is open for you.
Follow my page to get more beginner-friendly articles and you can also read my past articles by clicking on my page.


